Aggregate Demand and Aggregate Supply
Lecture 12
|
|
|
Aggregate Demand
|
|
Aggregate Demand – schedule that shows how much goods and services people want to buy for a price level
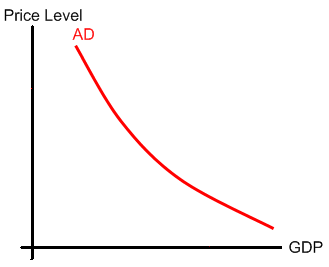
-
Price level – price index for all goods and services
-
GDP – total value of all goods and services produced in an economy in one year
-
Not a market demand function!
-
Negative Slope
-
Real Balance Effect
-
An increasing price level is inflation
-
A decreasing price level is deflation
-
As the price level increases, inflation reduces the value of money, saving, and investments
-
People buy less goods and services
-
Lower wealth
-
Interest Rate Effect – ignore
-
Foreign Purchase Effect – how one country’s price level compares to another
-
If the U.S. price level is higher to another country
-
U.S. imports more
-
U.S. exports less
-
Exchange rate did not change
-
AD Shifts
-
Economy has four sectors that buy goods and services
-
GDP = C + I + G +NX
-
C is consumers
-
I is business investment
-
G is government spending
-
NX is net exports
-
Trick – does it increase spending or decrease spending?
-
Consumers
-
Consumer spending
-
Real wealth
-
Household debt
-
Consumer expectations
-
Taxes
-
Business investment
-
Interest rates
-
Expected profits
-
Technology
-
Taxes
-
Production capacity
-
Gov. spending
-
International sector
-
Net exports
-
Exchange rates
-
Foreign income
|
Aggregate Supply
|
|
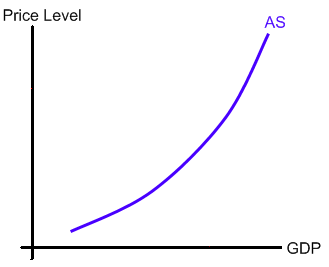
Aggregate Supply – schedule that shows amount of goods and services producers will supply
-
Short run – some resource prices do not change immediately to changes in price level
Resource prices : Manufacturing : Product prices
-
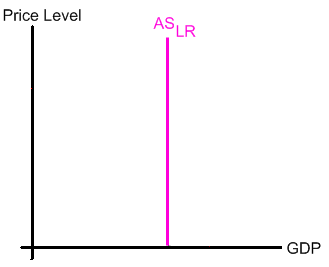
Long run – all resource prices change immediately to changes in the resource price
-
Short-run aggregate supply
-
-
Has positive slope
-
Why?
-
If price level increases, then producers produce more, thus GDP increases
-
Workers real wages decrease, so workers are “fooled” into producing more for a lower real wage
-
Change “fooled” into “exploited”
-
Long-run Aggregate Supply
-
-
All resource prices increase with the price level
-
Keynes – “In the long run, we are all dead!”
-
Thus, nominal prices are irrelevant for the long run
-
Note – hyperinflation causes society to breakdown, thus GDP decreases; problems with the AD-AS graph
-
Shifting the AS curve
-
Trick – does it increase or decrease business cost or resource prices?
-
Labor – immigration; causes wages to decrease
-
Capital – buildings, machines, and equipment
-
Materials
-
Productivity – workers produce more given the same output
-
Market power
-
OPEC – higher energy prices cause AS to shift left
-
Legal Structure
|
Equilibrium
|
|
-
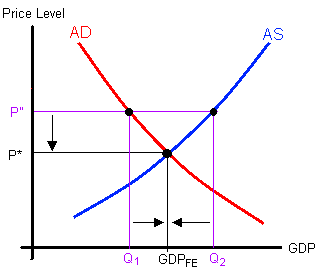
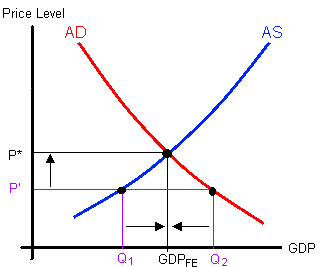
A price shock causes the price level to increase to P”
-
Price level is too high
-
Producers produce too much and consumers buy too little
-
Business inventories increase
-
Producers reduce production until economy is at GDP FE again
-
A price shock causes the price level to decrease to P’
-
Price level is too low; consumers want to buy more than what is available
-
Business inventories are falling
-
Producers increase production
|
Examples
|
|
-
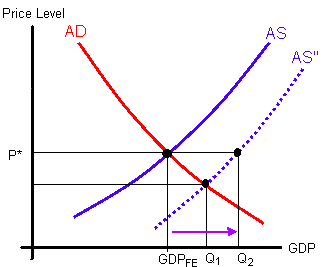
Government allows immigrants into the country
-
Wages fall; thus decreasing business costs
-
-
GDP may increase to Q 1 or Q 2, depending on the price level
-
Price level is ambiguous
-
If prices are flexible, then the price level falls and output increases to Q 1
-
If prices are “sticky” downward, then price level does not decrease and GDP increases to Q 2
-
Sticky prices may causes GDP to swing more than if prices were flexible
-
Why prices do not decrease?
-
Companies do not want to start a price war
-
Menu costs – company has to change prices in inventories, catalogues, etc.
-
Wage contracts – workers are “locked” into wage contracts
-
Unions
-
Minimum wage laws reflect a workers’ level of productivity
-
If a business lowered wages, then workers’ morale and work habits decrease
-
Workers lower production
-
Lower wages creates bitter feelings
-
Employees may steal more
-
Sabotage – plant a virus into a computer system
-
Espionage – post trade secrets on the internet or send it to competitors
-
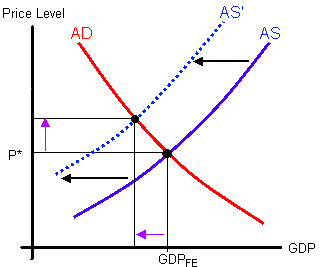
OPEC causes a price shock by increasing the price of oil
-
-
Petroleum is used in many manufacturing products, fertilizers, plastics, and transportation fuels
-
Thus, business costs increase, causing the AS curve to shift leftward
-
The GDP falls, causing a recession
-
The price level increases, creating inflation
-
Cost push inflation – the worst kind; the economy has inflation and a recession (i.e. higher unemployment).
|


