|
1. Sources of Corporate Stock
-
Investment banks
- help corporations issue new stock
- Not a regular bank
- Marketing agent for new securities
- Help corporation issue new stocks and bonds
- Help one corporation take over another
- This process is called underwriting.
- Underwriting lowers information costs
- The investment bank guarantees a stock or bond price for corporation
- Investment bank tries to sell the new stock or bond for a higher price.
- Required to disclose information to investors, preventing risk and fraud
- Prestigious investment banks
- Merrill Lynch
- Goldman Sachs
- Credit Suisse
- Organized exchanges - buy and re-sell stocks
- Secondary markets increase the liquidity of securities
- New York Stock Exchange (NYSE)
- Oldest and largest U.S. corporations are listed on the NYSE
- American Stock Exchange (AMEX)
- Less well known corporations are listed on AMEX.
- Only members, called
specialist
, can enter these exchanges.
- Example - if you want to buy Coca-Cola stock, you have to contact a broker who will contact a specialist at the New York Stock Exchange
- The specialist matches prices and quantity of stock for the buyers and sellers
2. Factors that influence whether a company pays dividends or not
- Small companies do not tend to pay dividends
- Have small earnings potential, but high growth potential
- If government taxes income from dividends higher than capital gains
- Investors would prefer growth in stock prices as opposed to receiving dividends
- CEO receives part of compensation in company's stock
- CEO may encourage growth in stock prices and less emphasis on dividends
- If company is paying dividends, then company may be optimistic about its future earnings
3.
Insider information
- investment bankers have inside information about corporate mergers
- Corporate merger causes stock price to increase
- Investment bankers can secretly buy stock or share information with friends
- Can make large amount of profit
- Illegal in the United States
- Regulated by the Securities Exchange Commission
4.
Market index
- a measure of broad movements in a financial market
- Dow Jones Industrial Averages
- Also called the “Dow” or “the industrials”
- Invented in 1882 and is the oldest index of the U.S. stock market
- Also the most popular index used today
- Calculate a weighted average by taking 30 representative stocks of market
- There are adjustments, when companies merge, bankrupt, stock splits
- Coca-cola
- IBM
- Proctor & Gamble
- Exxon
- Standard and Poor's 500 (S&P 500) is another index
- Two benefits
- Fast information - calculated in seconds and dispensed to investors
- Compiled by private company
- Not influenced by government, companies, etc.
- Wall Street Journal calculates the Dow.
5.
Stock Market Crashes
- Terminology
- Bull - investor believes stock prices will keep increasing (optimistic)
- Bear - investor believes stock prices will fall (pessimistic)
- A dramatic drop in stock prices during a short period of time
- Bankrupts investment companies, insurance companies, and commercial banks
- Banks grant loans to investors that investors cannot repay
- Also called a "financial bubble"
- Bubble is a dramatic, fast rise in assets prices. Assets price reaches a point where prices fall, bankrupting institutions in this market.
- A stock market crash in one market can lead to other stock market crashes to other markets, even in foreign countries.
- Market crashed on
- October 1929 - the start of the Great Depression
- Unemployment peaked at 26% in the U.S.
- October 24, 1929
- October 28, 1929
- October 29, 1929
- October 19, 1987
- New York Stock Exchange “crashed.”
- The Dow Jones fell by 508 points (or 27.8%) in one day.
- This was the largest loss in U.S. history
- Dot-com crash in March 2000
- Dot-com are internet companies
- October 11, 2007 - June 2009
- 2008 Financial Crisis
- Technically not a crash, but stock prices dropped in half in two year
- Wikipedia.org has list of stock market crashes
- Psychology behind the stock market.
- Investors are human!
- Investors see the Dow Jones increasing quickly
- They put more money into the stock market.
- More money into the stock market causes stock prices to increase further
- If investors see stock market prices decreasing, then they take their money out of the stock market, and stock prices decrease further
- Market moves in cycles
|
|
1. The value of an asset equals the present value of all the asset's future cash flows. Also call the present value the market price.
- Can build an infinite sequence
- Market price of a stock at time zero:
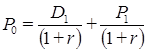
- P is market price
- D is dividends
- r is rate of return
- The subscripts are time.
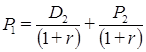
- Market price of a share of stock at Time 1:
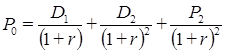
Substitute P 1 into P 0:
Keep building sequence, substitute P 2 into P 0, and so and until:
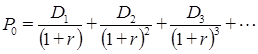
If dividends are all the same, D = D 1 = D 2 = ... = D n, then the market price becomes a perpetuity

- Example 1 - You want to purchase stock as a long-term investment.
- Your rate of return is 5% and you expect the corporation to pay $2 per share indefinitely.
- What is the market value of this stock?
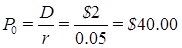
- What is the value of this stock in one year?
- A trick question
- You are expecting to receive the same dividends year after year, so the market price is still $40.00.
- There are no capital gains
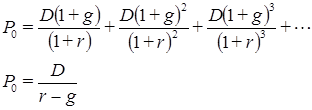
2. In some cases, the dividend can grow over time
- If the dividend grows at the same rate, then the present value formula can be updated to include a growth rate.
- The growth rate is g.
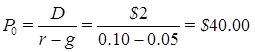
- Example 2 - You are wanting to purchase stock as a long-term investment.
- Your rate of return is 10%, you expect the corporation to pay $2 at Time 1, and dividends grow at 5%.
- What is the market value of this stock?
What if the growth rate of dividends grow at 2%?
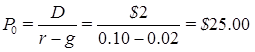
Why is it less?

|
There are two forces. The discount rate lowers the future value of cash flows, while the dividend growth rate make future cash flows more valuable. |
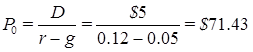
- Example 3 - You are wanting to purchase stock as a long-term investment.
- Your rate of return is 12%, you expect the corporation to pay $5 at Time 1, and dividends grow at 5%.
- What is the market value of this stock?
- What is the value of stock at Time 1?

- What is the percent change in stock prices?
% D P = ($75 - 71.43) / 71.43 = 0.05
- We can plot the relationship between growth rate and present value. If dividends is set at $1 , then the plot is below.
- Note: If g > r, then future cash flows become more valuable over time. Thus, the present value becomes negative.
- We can plot the relationship between rate of return and present value. If dividends is set at $1, then the plot is below.
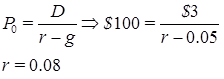
- Example 4 - If the stock price is $100 per share, dividends are $3, and are expected to grow 5% per year, what is the rate of return on this investment?
- Some corporations, especially in high-tech industries, initially pay low dividends. As corporation grows rapidly, corporation pays higher dividends.
- We can modify the net present value to handle this situation.
- Non-steady state - use present value to write out all cash flows
- Growth rate is not constant
- Steady state - dividends increase at a constant rate.
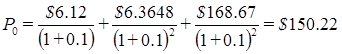
- Example 5 - If corporation pays a dividend of $6 at time 1, rate of return is 10%, and dividend grows 2% for first year, 4% for second year, and 6% for year 3 and beyond.
Solve for dividends for each year
Year 1: D 1 = $6(1+0.02) = $6.12
Year 2: D 2 = $6.12(1+0.04) = $6.3648
Year 3: D 3 = $6.3648(1+0.06) = $6.746688
- We also have to calculate the perpetuity associated with dividend paid in Year 3 and beyond.
- Remember the time subscripts.
- P is one period before the dividend payment.
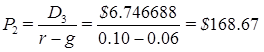
- Now we can construct the net present value of cash flows
- Example 6 - A new startup internet company will not pay dividends for the first three years.
- In year 4, the company will start to pay a dividend of $10 and will grow at 5% per year.
- The rate of return is 8%.
- First, D 1 = D 2 = D 3 = 0
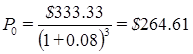
- In Year 4, then D 4 = $10; calculate the perpetuity.
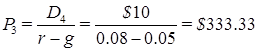
- However, this is in Year 3. Use net present value to obtain value in Time 0.
|
|
Definitions
-
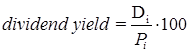
Dividends yield
- dollar amount of dividend divided by market price
-
Price-earnings ratio
- stock price divided by annualized earning per share

- Investor focuses on earnings and investment
- Notation
- Dividends are D
- Earnings are E
- New net investment is I

Net investment, I = Gross investment - depreciation
-
Depreciation
- accounting for wear and tear on machines, equipment, and structures
- If I = 0
- Company's investment just covers the degradation of its machines and equipment
- If I < 0
- Company may be in an industry in decline
- If I > 0
- Company may be in an expanding industry
- Dividends are expected to increase over time
Substitute D i = E i - I i into stock evaluation equation
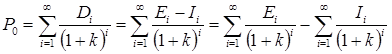
- Note - k replaced the rate of return
- k is called the market capitalization rate
High price-earnings rate, P / E
- Relatively low market capitalization rate
- k is in the denominator
- Small k causes NPV of earnings and net investment to be higher
- High NPV for added investments
- New net investment leads to higher growth in future dividends and earnings
- Growth rate of dividends is omitted from equation
References
Educational Service Bureau, 1992. How to Read Stock Market Quotations and The Dow Jones Averages: A Non-professional's guide. Dow Jones & Company, Inc.
Wikipedia. March 2012. "List of stock market crashes." Available at http://en.wikipedia.org/wiki/List_of_stock_market_crashes (access date: 3/15/12).
|