The Mean and Standard Deviation
Lecture 2
|
The Mean and Standard Deviation
|
|
-
Mean – the average for a data set
-
Median does not use all information
-
Calculate the mean by

-
Notation
-
X i is a data point, or an observation
-
n is the total number of observations
-
i is an index number
-
S is the summation symbol
-
Mean is central tendency; however, it is sensitive to outliers
-
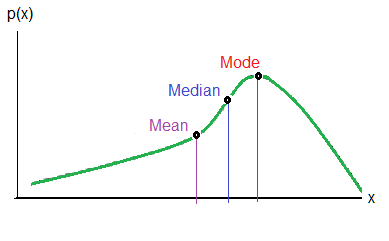
Mode – the data point that occurs most frequently
-
If the probability distribution is symmetric, then the mean = mode = median
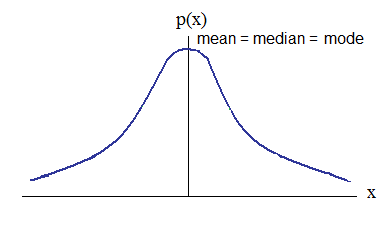
-
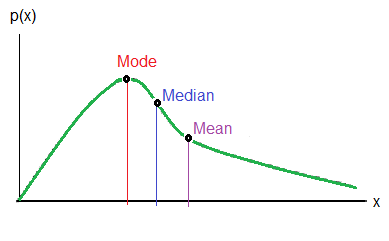
If the probability distribution is skewed, then the mean does not equal the mode and the mode does not equal the median
-
Example
-
Unordered: 10 32 5 6 7 5 4 5
-
Ordered: 4 5 5 5 6 7 10 32
-
The sum of the numbers is 74
-
Statistics
-
The mean is 74 / 8 = 9.25
-
The mode is 5
-
The median is (5 + 6)/2 = 5.5
-
Thus, the distribution is skewed
-
Standard Deviation – how spread out the distribution is
-
Uses all the data points
-
The s
2 is the variance
-
The hat means it is estimated
-
n – 1 is called the degrees of freedom
-
We are calculating (estimating) the variance, then we lose one piece of information
-
This is the sample variance
-
Population – all data that is included in your analysis
-
Maybe too costly, or too large, etc to collect population data
-
Sample – randomly select out of the population
-
The population variance is:

-
Notice – there is no hat; we have all data points and can calculate the population variance; it does not have to be estimated!
-
It is easy to calculate the sample variance from the population variance and vice versa

-
-
Usually rare to have the whole population data, so sample is always used
-
The population variance is written as:
-
Very easy to derive
-
The trick to the derivation
-
S is a linear operator
-
X bar and 2 are constant and can be distributed out
-
Calculate the variance for the sample
| Observations |
X i – 
|

|
| 5 |
5 – 4.6 = 0.4 |
0.16 |
| 6 |
6 – 4.6 = 1.4 |
1.96 |
| 3 |
3 – 4.6 = -1.6 |
2.56 |
| 5 |
5 – 4.6 = 0.4 |
0.16 |
| 4 |
4 – 4.6 = -0.6 |
0.36 |
|
|
5.2 |

-
-
Variance has one problem. If data is in $’s, then units for variance is $ 2
-
Take the standard deviation (SD)
-
Standard deviation has the same units as the mean and data
|
Probability Distributions
|
|
-
Statistics has many probability distributions
-
At least 20 distributions are popular
-
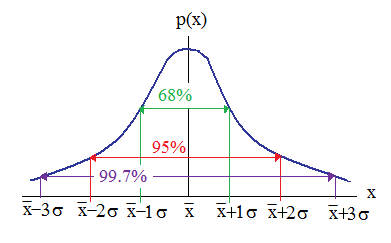
The most common is the Normal or Gaussian Distribution
-
“Bell shaped curve”
-
The mean and standard deviation can completely describe this distribution
-
Normal distribution – as the sample size increases to infinity, many of the other distributions become normal
-
Confidence intervals
-
From the last example, =4.6 and s = 1.141
-
68% of the data lies between
-
[4.6 – 1.141(1), 4.6 + 1.141(1)] = [3.46, 5.74]
-
95% of the data lies between
-
[4.6 – 1.141(2), 4.6 + 1.141(2)] = [2.32 6.88]
-
99% of the data lies between
-
[4.6 – 1.141(3), 4.6 + 1.141(3)] = [1.18, 8.02]
|
Data Transformations
|
|
-
If you have a positively skewed distribution, then use a transformation to make distribution “more symmetric.”
-
An example of a positively skewed distribution
-
Use natural logarithm
-
This function flattens the distribution
| Data |
Natural logarithm |
|
| . |
. |
|
| 45 |
ln45 = 3.8066 |
|
| . |
. |
|
| 50 |
ln50 = 3.912 |
This is the mean |
| . |
. |
|
| 100 |
ln100 = 4.605 |
An outlier |
-
Note – the mean of the data and the mean of log of the data will not equal

-
ln and exp are inverses of each other
-
The natural logarithm of a negatively skewed distribution will not work
|
Measurement Errors
|
|
-
Measurement Errors – errors in measuring the data
-
Within subject (or intra subject) – if you take another measurement on the same person, you get a different measurement
-
We can measure this variability
-
Coefficient of Variability (CV) is
-
Use CV to check variability of our measurement on one person
-
Between subject (or inter subject) – measurement error on each subject in sample
-
Example
-
One person’s heart beat is 60 beats per second and CV = 3%
-
Another persons’ heart beat is 80 beats per second and CV = 10%
-
Each person’s heart is different
-
Each sample has intra and inter measurement errors
|