|
-
If data is normally distributed, we can calculate a standard normal distribution
-
A normal distribution is:

-
The standard normal distribution is:


-
If m = 68, s
2 = 100, and the 87 th observation is X 87 = 70
-
The observation is standardized by
-
Form a confidence interval
-
Usually set a = 5% (or 0.05). It is okay to have an a = 10% or a = 1%

-
If a = 5%, then
-
For two sided confidence intervals, we usually put a/2 in each tail
-
Thus, z
a
/2 = z 0.025 = 1.96 for a standard normal
-
Example
-
 = 68, which is an unbiased estimate for the population parameter, m = 68, which is an unbiased estimate for the population parameter, m
-
The standard deviation is s = 10 and a = 0.05
-
We would expect 95% of the data to fall between [48.4, 87.6]
-
Standard Errors – use one sample to determine variability of population parameter, m
-
We have the following distribution
-
Take a random sample
-
n = 90, = 110, and s
2 = 81
-
We are assuming we know the variance now; usually this is unknown too!
-
We calculate the standard error (SE)

-
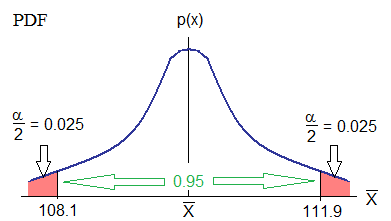
Form a 95% Confidence Interval

-
There is a 95% chance that the true population mean lies between [108.1, 111.9]
-
We assume we know s
2
-
However, we have to estimate s
2 too
-
We switch the distribution to a t-distribution

-
The t-distribution is shorter with fatter tails
-
Uses degrees of freedom
-
df = n – 1
-
The one is we estimated the variance, so we lose one piece of information
-
As the degrees of freedom approaches infinity, the t-distribution collapses onto the normal distribution
-
As the sample size becomes larger, the standard error becomes smaller. The confidence intervals become smaller too!
|