|
-
We take one sample and we calculate the mean
-
The Mean is the estimator of the true population parameter
-
Build a confidence interval, using a specific a, such as a = 0.05
-
There is a 95% chance that the true population mean lies within an interval
-
We take a second sample, and we get a different mean and confidence interval
-
Example – Average income for men and women
-
Men earn on average $40,000 per year
-
Women earn on average $30,000 per year
-
Hypothesis Test
-
We test whether the population parameters are the same or different
-
m
men: Population mean for men’s income
-
mm
women: Population mean for women’s income
-
Also, these hypothesis test are equivalent
-
A hypothesis test has to cover all situations
-
This hypothesis test is invalid
-
We are missing the case whether women have higher incomes than “ men
-
We choose a Significance Level, a
-
Type I Error – the error we make when we reject the true hypothesis, H 0
-
This occurs a% of the time
-
Type II Error – the error we make when we fail to reject a false null hypothesis
-
Denoted by b probability
-
We cannot observe this in the data
-
Usually researchers set a = 0.1, 0.05, or 0.01
-
These a’s have a good balance between Type I and Type II errors
-
Example
-
Choose a = 1 x 10 -6
-
The Type I error becomes smaller, but the Type II error becomes larger
-
You are increasing the chances of “failing to reject” a false null hypothesis
-
The Power is defined as 1 – b
-
The Power is the probability we reject the null hypothesis when it is false
-
We want 1 – b to be high
-
How do we increase the power?
-
The larger the number of observations, the more information we have; the more power
-
The type of statistical test
|
|
-
Testing the Hypothesis if two sample means come from the same population
-
Example
-
Assuming s is known, thus we use the normal distribution
-
We know from the table
|
Average Income |
Observations |
Standard Deviation |
| Men |
$40,000 |
200 |
$10,000 |
| Women |
$30,000 |
150 |
$5,000 |
-
We must combine the variances
-
We are assuming the variances are the same
-
Calculate the Standard Error (SE)

-
The z-test

-
In Excel, we can calculate the p-value for this z statistic
-
The function, =normdist(value, mean, std. deviation, cumulative)
-
value is the z statistic
-
mean is zero, because it has been standardized
-
std. deviation is 1, because it has been standardized
-
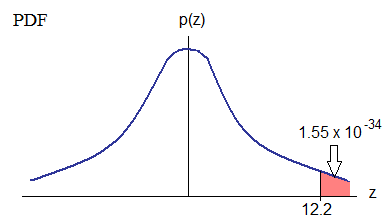
cumulative =1. We are calculating areas under the PDF (which is actually the CDF)
-
The p-value = 1.55 x 10 -34
-
Two cases
-
If the z is positive, then Excel returns [-z, z], so subtract the p-value from 1 to get the positive tail
-
If the z is negative, then Excel returns the proper p-value for a left side tail
-
We usually do a two tail test
-
We divide a by 2 and put this probability in each tail
-
The two tail test is shown below

-
Three ways to test a hypothesis
-
z-statistic
-
Reject the null hypothesis, if 
-
In our case, our z-value is 12.2 and our critical z is 1.96
-
Thus, reject the H 0 and conclude men and women have different income levels
-
p-values
-
Reject the null hypothesis, if 
-
In our case, our p-value is 1.55 x 10 -34 while our critical probability is 0.025
-
Thus, reject the H 0 and conclude men and women have different income levels
-
Confidence intervals
-
We can construct confidence intervals the test hypothesis
-
This method is shown in the next lecture
-
In reality, we never know the population parameter, s
2
-
Thus, when we estimate s
2, then we switch the distribution to a t-distribution
-
The analysis is the same; however, the methods to pool variances look more complicated
-
We only examined two-tail hypothesis test; however, this analysis can be applied to one tail hypothesis tests
|