Differences between Percentages and Paired Alternatives
Lecture 6
|
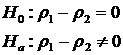
Percentages
|
-
Apply the same methodology to percentages
-
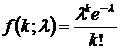
Where P is the percentage calculated from the data while r is the Greek letter that represents the population parameter
-
Using the same logic, the standard error (SE) is:
-
The variances are

-
This test is approximate because we are calculating the variances from the data
-
Then calculate the z-statistic
-
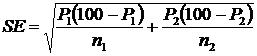
Example:
-
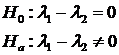
300 students are randomly chosen (n 1) at Suleyman Demirol
-
P 1 = 55% are women
-
1 – P 1 = 45% are men
-
400 students are randomly chosen (n 2) from the business school
-
P 2 = 60% are women
-
1 – P 2 = 40% are men
-
Are the same percentage of women studying business is the same percentage as the student body?
-
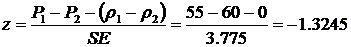
The hypothesis is:
-
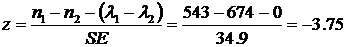
The standard error (SE) is:

-
The z-statistic
-
The critical z-value is 1.96. The p-value is 0.092669
-
Excel, the p-value is calculated from =normdist(-1.3245, 0, 1, 1)
-
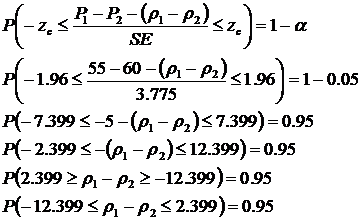
According to both the z and p values, fail to reject the null hypothesis and conclude both percentages are the same
-
Both the methods will give the same results. The z and p values are testing the same hypothesis from different angles
-
Note – Excel doubles the p-value for two-tail test
-
You can also use confidence intervals for hypothesis testing
|
Poisson Distribution
|
-
The probability of a number of events that occur in a specific time period
-
Counting distribution
-
Number of events
-
Number of deaths
-
Number of births
-
Number of accidents at a street intersection
-
The PDF is
-
k is the number of occurrences, k = 1, 2, 3, …
-
l is expected number of occurrences in interval
-
This distribution is unique, the mean = variance = l
-
Example: Heart disease
-
In 2008, there were 543 deaths (n 1)
-
In 2009, there were 674 deaths (n 2)
-
Is this increase in deaths due to chance?
-
The hypothesis is:
-
The standard error (SE) is

-
The z-statistic is:
-
Using a = 0.05, the z c = 1.96
-
Reject the null hypothesis and conclude the heart attack rate is higher
-
The z-statistic is approximate, because it came from a Poisson distribution
|
McNeman’s Test
|
-
You will not be tested over this test
-
It is an interesting test
-
You have an example where your sample has two treatments and the results are paired
-
Your sample had two experimental medications
-
A matrix of your results
|
Treatment A |
Treatment B |
| Outcome 1 |
Responded |
Responded |
| Outcome 2 |
Responded |
Did not respond |
| Outcome 3 |
Did not respond |
Responded |
| Outcome 4 |
Did not respond |
Did not respond |
-
You are interested if Treatment A is better than Treatment B?
-
Ignore Outcomes 1 and 4
-
Focus on Outcomes 2 and 3
-
Observations have to be paired
-
Example:
-
Each person gets both treatments
-
Or the sample is divided by 2 and then randomly pair one person to another
-
Example: 200 people with heart problems
-
Treatment A: Patients have to eat right and exercise
-
Treatment B: Patients take a drug, Plavix
-
Randomly pair sample into 100 pairs
|
Treatment A |
Treatment B |
Observations |
| Outcome 1 |
Responded |
Responded |
15 |
| Outcome 2 |
Responded |
Did not respond |
30 |
| Outcome 3 |
Did not respond |
Responded |
45 |
| Outcome 4 |
Did not respond |
Did not respond |
10 |
|
|
|
100 |
-
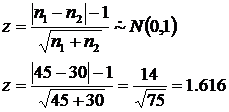
The n 1 = 45 and n 2 = 30
-
Calculate the z-statistic
-
Fail to reject the treatments are the same, because a = 0.05 and the z c = 1.96
-
Note – I could give all patients both treatments, but I have to discern which treatment did what
|