Exact Probability Test
|
|||||||||||||||||||||||||||||||||||||||||||||||||||||||||||||||||||||||||||||||||||||||||||||||||||||||||||||||||||||||||||||||||||||||||||||||||||||
Fisher Exact Test |
|||||||||||||||||||||||||||||||||||||||||||||||||||||||||||||||||||||||||||||||||||||||||||||||||||||||||||||||||||||||||||||||||||||||||||||||||||||
|
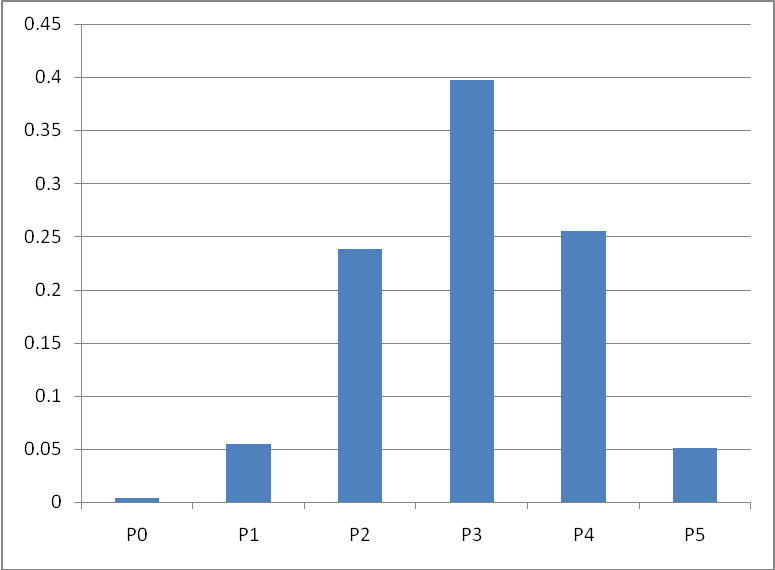
Combination 0
Probability of this combination occurring is
Combination 1
Probability of this combination occurring is
Combination 2
Probability of this combination occurring is
Combination 3
Probability of this combination occurring is
Combination 4
Probability of this combination occurring is
Combination 5
Probability of this combination occurring is
We manually map out the whole probability space for men on a diet
Is our particular combination significant? Are men different than women on a diet? Our data is P 2. If we choose an alpha of 5%, the best we can do in our case is to have an alpha of 11%. We take the probability that is in the tails. Alpha is the sum of P 0, P 1, and P 5. Since our value is P 2, we fail to reject and conclude men do not differ from women on a diet. |